

This DISCUSSION PAPER CONTRIBUTES TOWARDS THE FOLLOWING SUSTAINABLE DEVELOPMENT GOALS:


important note: you can click on the graphs to expand them. This will also be mentioned for each graph within the main text
ABSTRACT:
“COVID-19 had lead towards severe disruptions towards how society had interacted in
2020 and onwards. With work at home orders and other restrictions implemented, the need for daily
mobility had dwindled in the early stages of the COVID-19 pandemic. One interesting question is,
to what extent had early stage policies had an effect on gasoline demand in the Kingdom?
Furthermore, we also explore if this shock is permanent with a rise of interest in “stay-at-home”
work, and we also explore theoretical benefits and costs associated with these potentially permanent
shocks, and whether policymakers should take interest in further encouraging or discouraging them.
The data we consult is refined products marketed locally from National oil & gas authority, and
total vehicles registered from the General Directorate of Traffic/Ministry of Interior.”

MAIN BODY
INTRODUCTION
COVID-19 has led to severe disruptions in how society interacts in 2020 and onwards. With COVID-19 restrictions being placed in the earlier stages of the pandemic, the need for daily mobility towards work, education, and leisure centers had dwindled significantly. However, it is unknown to what extent the COVID-19 pandemic and its restrictions affected fuel demand in the Kingdom of Bahrain. This article aims to explore how the early-stage pandemic affected gasoline and diesel consumption in the Kingdom. Furthermore, we also extrapolate from the findings on the potential hypothetical benefits of transitioning to a “work at home” type of environment and whether this would have any significant economic effects that the Kingdom would reap.
The article will follow the following sections. First, we will look at our basic method of calculating estimated fuel consumption per vehicle in the Kingdom. Second, we will analyze the data and see how fuel consumption per vehicle evolved and whether there was a significant change in demand. Third, we look at the effects of actual and hypothetical benefits and costs associated with the demand change in 2020. Last, we then discuss the hypothetical benefits and costs if the Government introduced a permanent type of “work-at-home” policy to try and encourage both the public and private sectors to uptake such policies.
Data and Method for measuring fuel consumption per vehicle.
To construct our estimated fuel consumption per vehicle, we first need to obtain data on the total local fuel consumption and the number of vehicles registered. We use data from the National Oil & Gas Authority for our fuel consumption (National Oil & Gas Authority, 2020), where they report refined products marketed locally. This breakdown shows “products marketed” for Gasoline, Kerosene, Diesel, Asphalt, L.P.G, and Jet fuel. The data is in 1,000 US barrels sold, spanning from January 2009 to December 2020. For our analysis, we assume that the vast majority of vehicles registered in Bahrain are either powered by gasoline or diesel; thus, only these two fuels are used for our calculations. Next, we adjust the data for seasonal influences for our barrels sold using ARIMA X-12. Below is a graph showing the total barrels (per 1,000) sold from 2009 to 2020 (right side of page)
click to expand the graph
The graph captures shocks towards fuel demand relatively well, where we see the effects of Arab Spring in 2011 and COVID-19 in 2020. Overall, it appears that our fuel usage has steadily increased over the past ~12 years. Looking at our vehicles, we use the total registered vehicles from the General Directorate of Traffic / Ministry of Interior (General Directorate of Traffic & Ministry of Interior, 2020). The data frequency is annual, which spans from 2004 to 2020. To “convert” our data in monthly intervals, we use a linear time trend as our estimated total monthly vehicles registered in the Kingdom. Below are actual cars registered and a simple linear trend (the basis for our monthly estimates):
click to expand the graph
We see that a linear trend captures total vehicles relatively well throughout our time period. Using our seasonally adjusted total fuel consumption and our estimated monthly total vehicles registered, we calculate the estimated fuel consumption by dividing the total fuel consumed by the total estimated monthly vehicles.
Page 1
Once we’ve obtained our estimated fuel consumption per vehicle, we then fit a linear trend towards our data and a Hodrick-Prescott (HP) filter, which allows us to remove what we refer to as “cyclical” data components to derive a smoothed trend line.
Results
Below are the results of fuel consumption per estimated vehicle with our linear trend and HP filter trend:
Click to expand the graph
The graph above reveals two interesting outcomes. The first is that of fuel efficiency. Given that Bahrain is a major importer of motor vehicles and parts (with Japan being the most significant import partner of ~50% of all car-related imports in 2020 (OEC, 2020), it appears that the Kingdom has benefited from changes in fuel efficiency from motor vehicle producers. Using our example of Japan, the fuel efficiency of petroleum vehicles had seen a ~25% increase in fuel efficiency from 2009 to 2020 (IEA, 2021), similar to the ~32% decrease in estimated barrels per vehicle consumption in Bahrain measured in this graph.
The second important item to note is the shocks we see. Similar to the initial exploration of total barrels consumed, the shocks have been replicated with the 2011 Arab Spring and 2020 COVID-19 pandemic effects. The item we are interested in is the COVID-19 pandemic. Using February-2020 as our starting point, we can see how much has our estimated consumption deviated from the trend paths we’ve created (right side of page).
Click to expand the graph
The results indicate that COVID-19 had a significant shock on fuel demand in the Kingdom. We see that fuel consumption was ~6-9% above the trend lines we've fitted, whereas, in May, this difference had reduced to ~23 to 27% below the trend lines. Compared to the Arab spring, we see similar reductions in fuel usage; however, the effect was less prolonged and quickly recovered after a dip in March of 2020. We see that the COVID-19 pandemic had a significant shock on the Kingdom's domestic fuel demand; however, what are the actual and hypothetical benefits and costs associated with this? We explore them in the next section.
Actual and Hypothetical Benefits and Costs from COVID-19 shock on Fuel Demand
We will begin with actual (measurable) yielded benefits from the COVID-19 shock on fuel demand. The first is towards the fiscal position of the Kingdom. Historically, the Kingdom had heavily subsidized the price of local oil and gas markets where a fixed price was in place for gasoline and diesel. Therefore, we can estimate how much the government “saved” due to the demand shock on fuel in the Kingdom. Using the Kingdom’s fiscal budgets (MOFNE, n.d), we can create an estimate based on the following assumptions (next page):
Page 2
We assume that the net subsidies towards the oil and gas market are based on estimated demand for the fiscal year.
Our next assumption is that using a linear trend and H.P. filter on locally sold petroleum products (all forms, including L.P.G., kerosene, Asphalt, and Jet fuel), these two fitted lines towards our data will form the “estimated demand” that the government uses. To further expand on this assumption, this will assume that each barrel of petroleum products is equally subsidized as net subsidies are based on total demand.
We then calculate the “net subsidy per barrel” rate, approximately 2.245BHD under the linear trend and 2.443BHD under the HP filter.
Using actual fuel consumption per vehicle and their linear and HP trend, we can measure the “total net subsidies” and “budgeted net subsidies” in each month based on our estimated total vehicles.
In our final step, we then take the accumulated “total net subsidies” and subtract them from the accumulated “budgeted net subsidies.” We then represent the difference as a percentage of the budget.
Below is the graph which shows the budget surplus/deficit % for net subsidies:
Click to expand the graph
We see that under our assumptions, given the substantial reduction in fuel consumption, we would see an estimated budget surplus of ~4 to 9% by the end of the year, equivalent to 700K to 1.9m BHD. Compared to the overall budget, this would represent approximately ~0.02% to ~0.05% of the overall total public expenditure and ~0.02% to ~0.06% of overall recurrent
expenditures. If we used the peak difference of May (being a budget surplus of 8.81% to 12.10%) and assume this was sustained (i.e., fuel demand remains at a permanent lower state), the savings from net subsidies ~1.7m BHD to ~2.5m BHD, or around ~0.06% to ~0.08% of total recurrent expenditures. While the savings are insignificant towards the total recurrent and public expenditures, the savings are substantial towards subsidies provided towards local markets.
The next benefit we will examine is that of air quality. Using the air quality index (AQI) (The world air quality project, 2022), we can construct a scale of 0 to 9 on the indication of air quality in Bahrain from month to month where the scales represent the following AQI values.
Click to expand the table
Using data from 2016 to 2021, we can construct and look at the average air quality and their +/-1 standard deviation values. We can then plot the average air quality values for each year. Below is Bahrain’s air quality from 2016 to 2021
Click to expand the graph
Page 3
The graph indicates that air quality in Bahrain averages at approximately 4.50 on our scale, placing it on average under “unhealthy for sensitive groups.” However, the value can increase to 5.15 with a +1 standard deviation, placing air quality closer to the “unhealthy” range on average, where the value can also fall to 3.91. From the graph, we see that Air quality on average appears to be lowest in 2020, with a value of 4.08. Furthermore, if we look at air quality specifically in 2020, we see even more indications of improved air quality:
Click to expand graph
We see that although in our specific period of shocks (being February through May), we do not see Air quality necessarily being closer to the lower boundary, we see some frequent drops in June and August, and it appears the AQI index moves closer to the lower boundary. This indicates that air quality had improved with some form of a lagged effect with the reduction in fuel demand. The effects are likely to be significant, as estimates place ~15% of deaths related to air pollution in the Kingdom compared to the ~12% for the world in 2019 (Ritchie and Roser, 2017). Therefore, a temporary reduction in air pollution may have positive impacts by preventing deaths that would have otherwise occurred if air quality were at the levels that we expect based on our sample data. Furthermore, from our sample data, satellite observation has shown that the GCC experienced a substantial drop in air pollution (NO2 levels) between November 2019 and March 2020 (MBRSC, 2020).
Other potential benefits that are not readily measurable for this article include a reduction in congestion, which may also affect needed recurring expenditures for highway and road maintenance due to less wear and tear. However, while there are some potential benefits from our estimated fuel consumption, it’s important to note the apparent costs. The most prominent is that the reduction in estimated fuel consumption is associated with a reduction in general economic activity throughout the pandemic. Furthermore, a reduction in fuel consumption can also be associated with a reduction in demand for services related to motor vehicles. However, in our next section, we can argue that the pandemic has provided us with a glimpse of how a permanent work at home order may provide the same benefits relative to different potential costs.
Potential benefits and costs from a permanent stay at home scenario
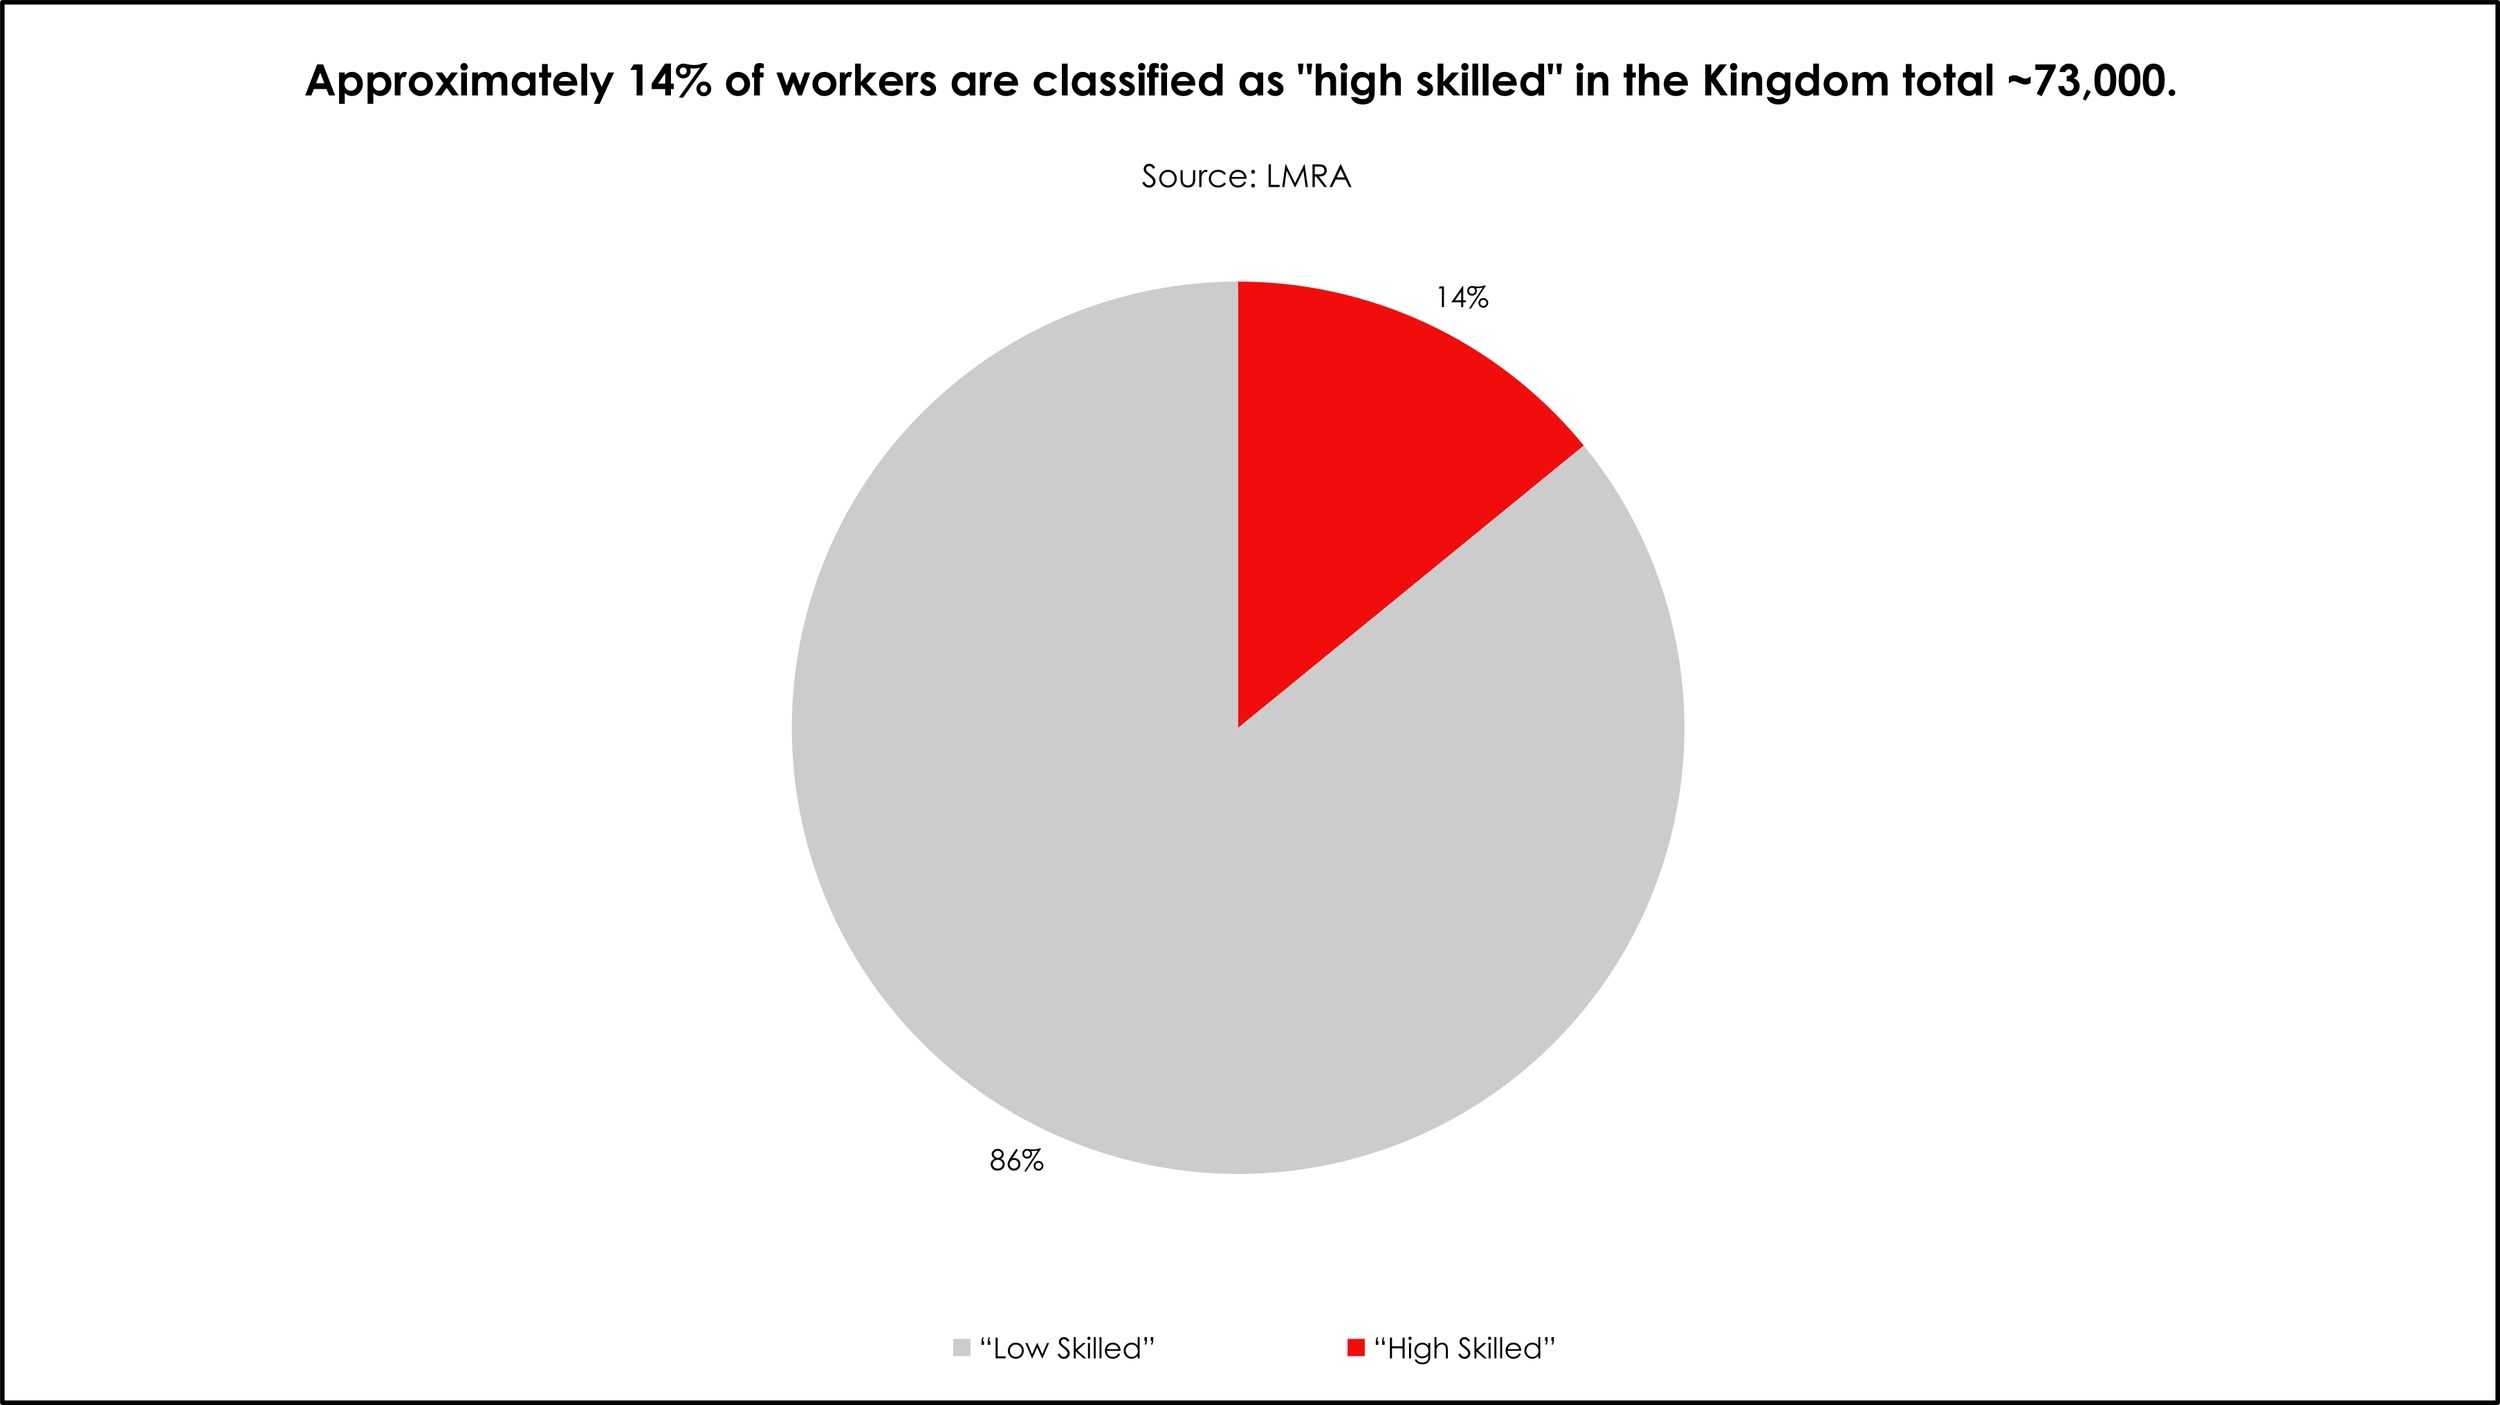
The temporary reduction in fuel demand across the Kingdom provides a glimpse into what could be the scenario of a permanent type of reduction in fuel demand. The first thing we should look at is to see the potential number of employees who can potentially work at home permanently. This can be done by looking at employment by industry or by education. For this discussion paper, we will look only at education, which allows us to make more simplified assumptions. We can classify “high-skilled workers” as more likely to work at home (defined as Diploma/Bsc and above). Conversely, those classified as “low-skilled workers” are more likely to be required to work at their workplace (defined as below Diploma/BSc). Below is a graph that shows this breakdown.
Click to expand the graph
Page 4
The total amount of “high skilled” workers in the Kingdom is 73,000, which represents ~14% of the overall labor force (it’s important to note there are some uncertainties surrounding the data whether Table 8 from LMRA represents both public and private sector, or simply the private sector). This represents a potentially significant amount of the labor force that may be able to “work at home.” Even if only a small percentage of the “high-skilled” workers can permanently “work at home,” this may have potential long-run fuel consumption savings given the need to travel less. During rush hours, congestion would be highest, and thus fuel efficiency would drop considerably. In the United States, excess fuel consumption from congestion as a percentage of total motor vehicle gasoline supply reached an all-time high of 2.44% in 2019:
click to expand the graph
Although there is no readily available data for Bahrain, given that previously we’ve established that the number of registered vehicles per kilometer of road has increased by nearly 7% per year on average (Rabayah, 2021), it is likely that congestion has also increased over the long-term. Thus excess fuel consumption due to congestion is expected to have increased. Ultimately, depending on how many of our “high-skilled” workers can work at home will determine how much fuel savings can be achieved.
The following hypothetical benefit that may be derived from a “work-at-home” type of policy is the effect on households leisure time or labor supply. Given peak traffic times would occur during the beginning of a work day (and the end), this represents potentially unnecessary time wasted on transportation. This transportation time can be placed into more leisure time or potentially even higher labor supply. Generally speaking, a household supplies labor in two ways: in the market (working) and home production (cooking, cleaning), where home production is not measured, given that a market price is difficult to assign. In the event of more leisure time, a household may use this transportation time for other activities that are not of home production (sleeping, watching TV, consuming goods and services), thereby deriving more utility. On average, 16.22% of total household expenditures are allocated towards transportation (2,817BHD per year) (IGA Bahrain, 2015), where this number increases to 17.29% for Bahrainis (3,449BHD per year). A reduction in transportation time may mean more leisure activity elsewhere, thus generating additional economic activity away from transportation expenditures.
Furthermore, some forms of higher leisure activities may derive higher productivity. For example, assume that households in Bahrain are sleep-deprived. With a work-at-home type of policy adopted by the private and public sectors, depending on the amount of time saved from transportation may help alleviate sleep deprivation. Sleep deprivation can significantly impact job performance (Newsom and Wright, 2022); thus, work at home policy may indirectly help productivity due to increased sleep duration (thereby reducing sleep deprivation).
In an alternative case, assume that households are not sleep deprived. In this scenario, assume that households do not want to undertake higher leisure activity but are enticed by potential higher wages from more labor supply provided. The hours saved from a work-at-home policy can be translated into more hours worked, thereby increasing overall economic activity. This, in turn, would have positive implications for higher real wages and output as such a policy and its hypothetical outcomes may represent a shift in aggregate supply.
Page 5
Ultimately, it is not entirely clear to what extent the hypothetical benefit of a “work-at-home” productivity with extra available time will have on leisure and labor supply. Furthermore, this doesn’t take into account the potential of lower productivity in a work-at-home scenario if employees not being monitored would lead to lower work effort (whereas in an office scenario, monitoring of employees may be beneficial towards productivity due to potential “punishment” that employees may receive if they were unproductive). Consulting the literature, there are currently two studies that look at the effects of “work-at-home” on productivity. One study conducted a randomized control trial with a Chinese company (Bloom et al., 2015) which found that call-center employees assigned to the treatment group saw a 13% performance increase, primarily due to having fewer breaks and sick leaves. On the other hand, a study on co-workers across European nations (Van Der Lippe, Lippenyl, 2019) who worked from home sees that some individual workers may be more productive; however, co-workers may see an impact on employee performance, and thus team performance may also take a hit. Ultimately this shows that while “work-at-home” may have productivity benefits, the effects aren’t straightforward. It may potentially be contingent on the type of work conducted and how much cooperation is required amongst employees.
Discussing the potential costs of a “work-at-home” policy, one immediate cost would be that of potential stranded assets. Since businesses pre-COVID may typically rent and own their office spaces, a permanent transition towards a “work-at-home” policy may result in stranded assets. As a result, demand for office spaces may fall, thus reflecting a fall in rental rates and asset prices for office workspaces. This would have a significant cost on the economy in direct and indirect ways (direct towards Real Estate and construction firms, indirectly via a reduction in aggregate income). As of 2020, nearly 28% of all buildings are used for non-residential purposes (commercial and non-commercial) (IGA Bahrain, 2020), where this is consistent/differs for each governorate (right side of page)
Click to enlarge the graph
The above shows that the Capital Governance has a significant concentration of non-residential buildings compared to the other three, indicating that there are potentially more “office spaces” within these areas, which in turn, suggest that a potential higher fraction of “high-skilled labor” would be settled within this area. As a result, a transition towards a “work-at-home” policy may reduce demand for these office spaces and thus potentially affect their real estate values.
Page 6
Conclusion and future recommendations
From the above, we see some rather interesting outcomes. In terms of results, we see that Bahrain appears to benefit from a long-term reduction in fuel consumption per vehicle, likely to reflect improved fuel efficiency for ICE vehicles. Furthermore, we also show that the pandemic appeared to have a substantial effect on fuel consumption in the Kingdom. The benefits derived from this are the potential savings for fuel subsidies and the possible improvement of air quality due to the reduction in vehicular emissions. However, it is important to note that the data reflects a decline in overall economic activity throughout the early stages of the pandemic and that such a decline reflects a substantial cost.
However, the data above gives us a glimpse of what may be a possibility with a “work-at-home” type of policy implemented by the government. Suppose most “high-skilled” workers can work from home in a permanent setting across the private and public sectors. In that case, this will generate a potentially significant reduction in fuel usage and a reduction in excess fuel consumption. Furthermore, hypothetical benefits may also include more leisure or labor supply decisions that economic agents may take. While there are potential benefits associated with the policy, one possible considerable cost would be that of stranded assets, given that firms and owners of properties have spent significant amounts on office properties, where a permanent reduction in the demand for office spaces may have significant impacts towards non-residential office spaces rental and property values.
While the data and discussion above provide us with a “rough” indication of the potential benefits and costs of such a policy, measuring such benefits requires an in-depth study, which would be a randomized control trial (RCT). RCTs, when done right, can provide powerful insights (such as the study conducted on a Chinese company on employees who were selected to work from home) on what are the causal effects of a work-from-home type of policy. Moving forward, the government should look at conducting an RCT where volunteers from the trial can be placed into a treatment and control group to measure their outcomes in terms of leisure time, labor supply, productivity, and transportation habits to get a better understanding to what extent would a permanent work-at-home policy would have towards the overall outcomes of some of the benefits and costs which were discussed above.
Page 7

SOURCES
Bloom, N., Liang, J., Roberts, J. and Ying, Z., 2015. Does Working from home work? Evidence from a Chinese Experiment*. [online] Stanford University. Available at: <https://nbloom.people.stanford.edu/sites/g/files/sbiybj4746/f/wfh.pdf>
General Directorate of Traffic & Ministry of Interior, G., 2020. Bahrain Open Data Portal Home. [online] Bahrain Open Data Portal. Available at: <https://data.gov.bh/>
IEA, I., 2021. Fule Economy in Japan. [online] IEA. Available at: <https://www.iea.org/articles/fuel-economy-in-japan>
IGA Bahrain, I., 2015. Bahrain Open Data Portal. [online] Bahrain Open Data Portal. Available at: <https://data.gov.bh/>
MBRSC, M., 2020. GCC sees drop in air pollution amid Covid-19 lockdowns. [online] Arabian Business. Available at: <https://www.arabianbusiness.com/industries/healthcare/444222-gcc-sees-drop-in-air-pollution-amid-covid-19-lockdowns>
MOFNE, M., n.d. Financial Framework. [online] Ministry of Finance and National Economy, Bahrain. Available at: <https://www.mofne.gov.bh/FinancialFramework.aspx>
National Oil & Gas Authority, N., 2020. Bahrain Open Data Portal, Home Page. [online] Data.gov.bh. Available at: <https://data.gov.bh/>
Newsom, R. and Wright, H., 2022. The Link Between Sleep and Job Performance. [online] Sleep Foundation. Available at: <https://www.sleepfoundation.org/sleep-hygiene/good-sleep-and-job-performance>
OEC, O., 2020. Bahrain Imports 2020. [online] OEC World. Available at: <https://oec.world/en/visualize/tree_map/hs92/import/bhr/show/1787/2020/>
Rabayah, B., 2021. Should cars be taxed?. [online] Bahrain Research Group. Available at: <https://www.bahrainresearchgroup.com/articles/2021/10/10/should-cars-be-taxed>
Ritchie, H. and Roser, M., 2017. Air Pollution. [online] Our World in Data. Available at: <https://ourworldindata.org/air-pollution>
The World Air Quality Project, T., 2022. Manama US Embassy Air Pollution Real Time AQI. [online] aqicn. Available at: <https://aqicn.org/city/bahrain/manama/us-embassy/>
Van Der Lippe, T. and Lippenyl, Z., 2019. Co-workers working from home and individual and team performance. [online] Wiley Online Library. Available at: <https://onlinelibrary.wiley.com/doi/full/10.1111/ntwe.12153>

ABOUT THE AUTHOR
.
