
PRELIMINARY
All Data collected and presented, unless stated otherwise, is collected from the Information & eGovernment Authority (IGA)
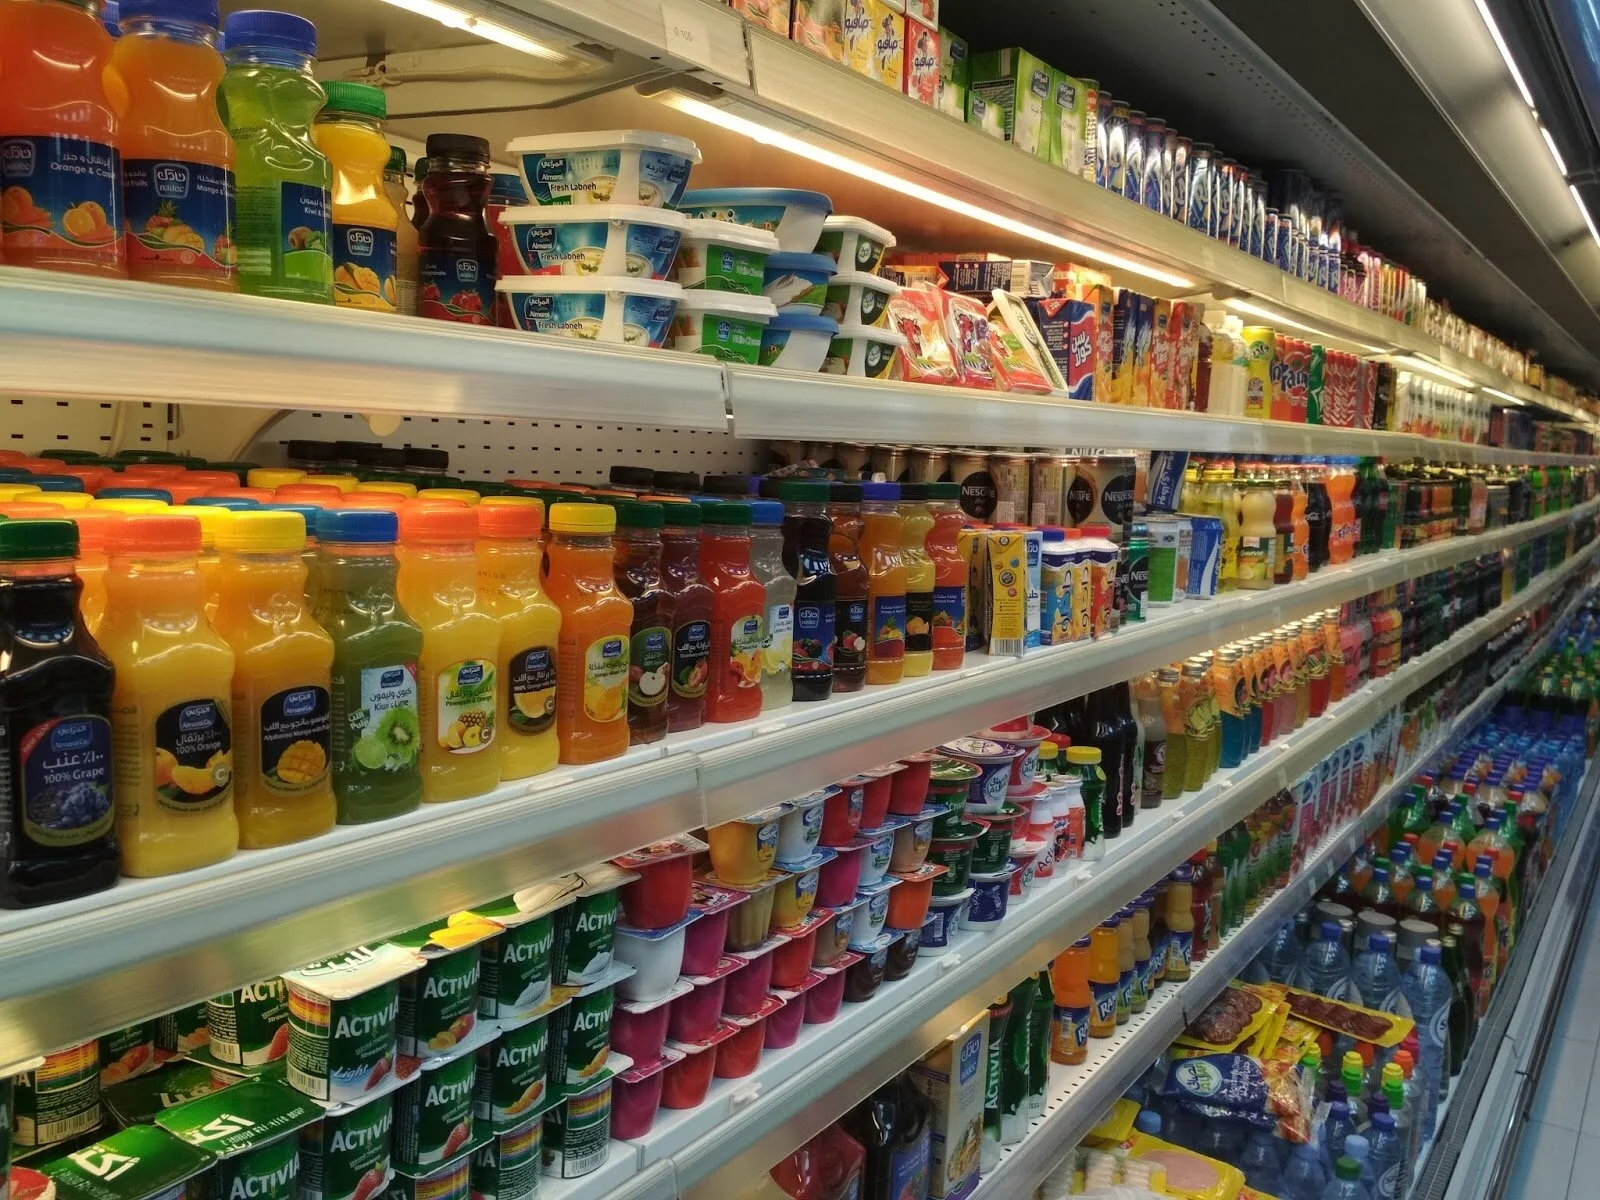
Image source: Best of Bahrain
INTRODUCTION
Is there a large variation in prices during Ramadan and Eid in Bahrain? If so, to what extent do they change? Through a basic data analytic overview, this article will investigate whether we observe such a fluctuation in prices during the season of Ramadan and Eid in Bahrain. Understanding whether these prices change seasonally can prove to be important for policymakers in the country. In particular, economists believe that decision-makers should use data based on the real trends of price levels, which is achieved by applying seasonal adjustments to the data.
What results do we expect to see? We expect to see alcohol products’ prices to fall during the month of Ramadan, and potentially increase in the preceding and following month, as alcohol shops that sell these products would be closed throughout the Ramadan period. The second expectation is that we expect to see food and non-alcoholic beverage prices significantly rise in the months of Ramadan, as the demand for household food items and non-alcoholic beverages significantly increase. Alternatively, we may see that food and non-alcoholic beverage prices do not rise during Ramadan, as supermarkets and other outlets that sell these products may have already anticipated demand from Ramadan shopping, where such supermarkets and shops will increase supply. In addition, policies such as price controls on certain goods may lead to little change in general prices for such goods.
How will we measure the effects of Ramadan and Eid on prices?
First, we need to identify the dates of Ramadan and Eid between 2008 to 2020. Below is the list of Ramadan dates (Eid Al-Fitr generally follows as the day after Ramadan, thus there is no need to list those dates as the effect will be in the same time-period).

After identifying the dates of interest, we will now need to collect the data for price levels from 2010 to 2019.
For price levels, we use Bahrain’s Consumer Price Index (CPI). CPI is a measure of the change in the price of a weighted-average basket of consumer goods and services in an economy. Generally, CPI is measured as an index, where a certain period is referred to as the “base period” of which prices are then compared to. We measure the price levels between 2010 and 2019. However, there are several issues with regards to the data, which are discussed in the appendix.
Within the analysis, we will first calculate the Month on Month Inflation Rate. From there we will perform the following calculations:
Average inflation rate of Ramadan Months
Inflation rate average for the year
inflation rate average for the year without Ramadan dates
After calculating the inflation rates for overall CPI and each major component, we will then perform the following calculations:
Take the difference between the Ramadan dates and the average for the year
Take the difference between the Ramadan dates and the average without the Ramadan months.
We want to look at the difference in the inflation rates between the months of Ramadan and the overall Month to Month inflation rate average for the year, because if there is a measurable difference in the inflation rates over the nine years of data, we want to know how much of a difference we observe, and in which categories we observe differences in them throughout the selected years.
Results of the raw data analysis
Below is a graph summarizing the differences in price levels during the Ramadan period compared to the yearly average, as well as the differences in price levels during the Ramadan period compared to the yearly average that does not take into account Ramadan dates.
Click the image to expand
From the data, we see that overall price levels are 0.23% to 0.25% higher during the Month of Ramadan compared to the yearly average month on month inflation rates. In addition, we see varying effects on different sub-categories of Bahrain’s CPI index. Firstly, we see that, as predicted, the average month on month inflation rates for alcohol products are 0.44% to 0.54% lower during the months of Ramadan when compared to the yearly average.
The next expectation was that we would see Food and Non-Alcoholic beverages prices would significantly rise during the month of Ramadan compared to the yearly average. Furthermore, we see that month to month inflation rates for food and non-alcoholic beverage items are 0.85% to 0.98% higher in the months of Ramadan versus the yearly average, which we also anticipated.
Next, we look at other categories that we had not made predictions on. With Clothing and Footwear, we see significant increases in price levels during the month of Ramadan in comparison to the yearly average - MoM average inflation rate is 0.56% to 0.65% higher during that period. This may be due to an increase in individuals gifting each other with such goods. We also see that Transportation prices significantly decrease during the month of Ramadan, where MoM average inflation rates for transportation is 0.47% to 0.55% lower than the average rate throughout a given year. A potential reason for this is that individuals may be less willing to travel during the months of Ramadan as they would be observing their fast, so transportation companies may reduce their prices during this period.
Overall, it seems that during the month of Ramadan, we do see the expected price movements when looking at the difference in MoM inflation rates between the Ramadan period and the yearly average across the selected nine years of analysis. However, it is important to note that this analysis does not necessarily confirm such a relationship, as more advanced statistical methods such as a Difference-in-Difference analysis would be more appropriate to investigate to what extent, if any, do prices change during Ramadan as a result of short term rises in demand. If these differences in price levels are in fact confirmed by more advanced statistical methods, then it may be appropriate for IGA to apply seasonal adjustments to its data in order to account for the annual trends around the Ramadan period.
Conclusion
In this article, we explored why we may want to seasonally-adjust our data, and the kind of events that may lead to “usual” movements in data during specific periods of time. Lastly, we looked at the link between the period of Ramadan and changing price levels, where we did observe some indication of the existence of seasonal fluctuations in prices due to a rise in demand for products such as food items and non-alcoholic beverages (and reduction in demand for alcoholic beverages). If advanced statistical methods can confirm our findings, then a potential policy recommendation for the IGA would be to adjust their CPI data for seasonal movements in prices due to Ramadan.

ABOUT THE AUTHOR

APPENDIX-ISSUES around cpi data collected
Here, we will discuss issues in regards to the CPI data collected. The first issue is that IGA had re-based it’s CPI data to April 2019. As a result, we had to manually calculate what would be the CPI from April 2019 and onwards for a 2006 base year data by using the 2019 CPI data inflation rates. The second issue that arises from CPI data is that IGA, in the new dataset, had began publishing each CPI’s category in further detail from 2019 onwards. Unfortunately, this was not done for the older dataset, where this would be even more useful for the data analysis to see what items within a given sub-category are seeing significant price changes. Lastly, there were some missing data for some of the earlier dates which makes it impossible to analyze the effects of Ramadan and Eid on price levels on CPI to start from 2009, and therefore we started the analysis from 2010. The dates which are affected by the missing monthly data are August 2009, February 2010, March 2011, and October 2011. The solution to this was to use the previous month’s inflation rate to fill in the missing data.